PERFORMANCE HIGHLIGHTS
|
KEY FINANCIAL DATA |
2020 |
2019 |
Change YoY |
|
|
|
|
|
|
Operating Revenue (RMB billions) |
303.84 |
290.51 |
4.6% |
|
Of which: Service Revenue (RMB billions) |
275.81 |
264.39 |
4.3% |
|
EBITDA1 (RMB billions) |
94.14 |
94.36 |
–0.2% |
|
As % of Service Revenue |
34.1% |
35.7% |
–1.6pp |
|
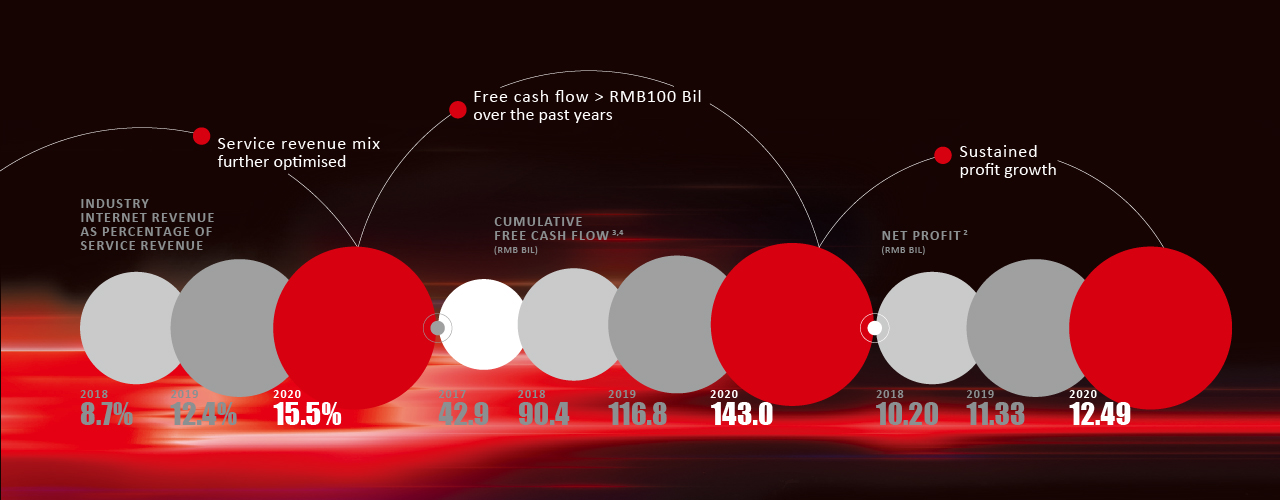
Net Profit2 (RMB billions) |
12.49 |
11.33 |
10.3% |
|
Basic EPS (RMB) |
0.408 |
0.370 |
10.3% |
|
Free Cash Flow3 (RMB billions) |
26.2 |
26.4 |
–0.8% |
|
|
|
|
|
| Note 1: | EBITDA represents profit for the year before finance costs, interest income, share of net profit of associates, share of net profit of joint ventures, other income-net, income tax expenses, depreciation and amortisation. As the telecommunications business is a capital intensive industry, capital expenditure and finance costs may have a significant impact on the net profit of the companies with similar operating results. Therefore, the Company believes that EBITDA may be helpful in analysing the operating results of a telecommunications service operator like the Company. However, it is a non-GAAP financial measure which does not have a standardised meaning and therefore may not be comparable to similar measures presented by other companies. |
| Note 2: | Net profit represented profit attributable to equity shareholders of the Company. |
| Note 3: | Excluded the impact of adoption of IFRS/HKFRS 16 on free cash flow in 2019 and 2020 (i.e. free cash flow = operating cash flow — CAPEX — capital element of lease rentals paid.) |
| Note 4: | Calculated the cumulative free cash flow generated since 2017. |